
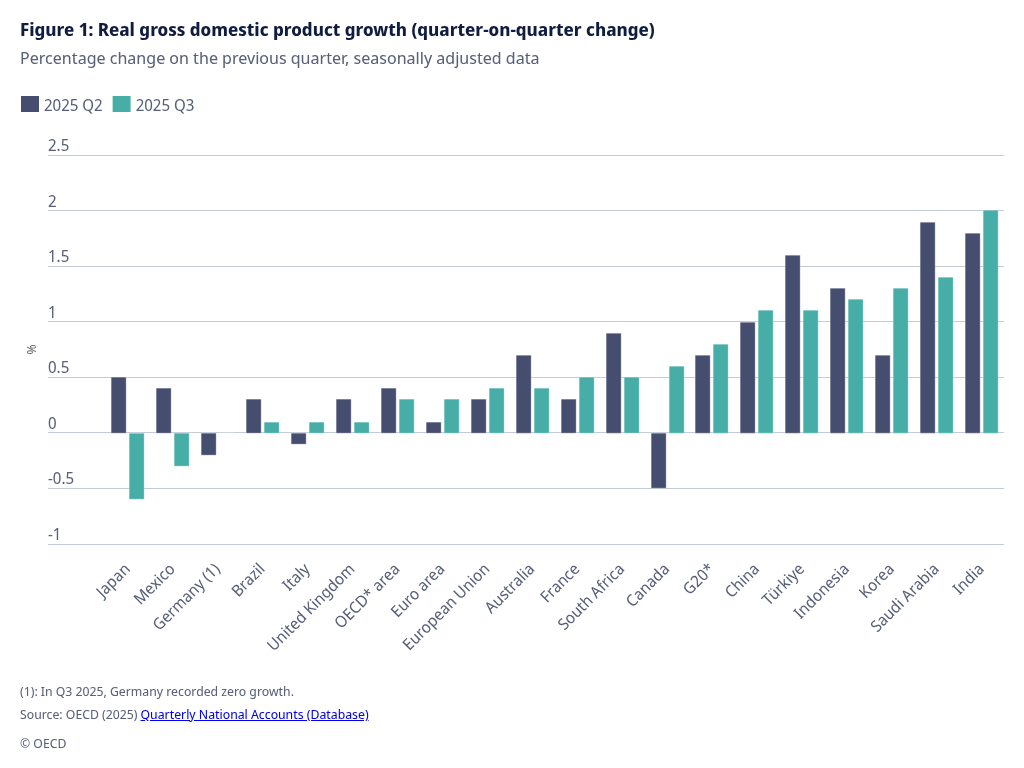
Figure: Real GDP growth, quarter-on-quarter change (Q3 2025).
Source: OECD (2025), Quarterly National Accounts.
📊 OECD Economic Indicator Brief (1-minute read)
Country or region: G20 economies (OECD aggregate excluding the United States for this dataset)
Indicator: Real GDP growth (quarter-on-quarter)
Snapshot
Indicator name: Real GDP growth (G20*)
Latest value: 0.8% (Q3 2025)
Upper reference range: 1.3% (highest quarterly value in the series shown for individual G20 members, Korea in Q3 2025)
Lower reference range: –0.6% (Japan and Mexico in Q3 2025)
Indicator detail
• Indicator name: Real GDP growth (G20*)
• Latest value: 0.8% (Quarter 3 2025, seasonally adjusted)
• Comparison to previous period: ↑ 0.8% in Q3 2025 from 0.7% in Q2 2025
• Year-ago comparison: ↑ 3.1% year-on-year in Q3 2025 (G20*)
• OECD average: In the OECD area (excluding the US) the corresponding quarterly growth was 0.3% in Q3 2025
(Note: G20* here excludes the United States because the OECD release did not include full US data at cutoff.)
Context
In the third quarter of 2025, GDP across the G20 countries for which data were available was 0.8% higher than in the previous quarter, up from 0.7% in Q2 2025. This series reflects a marginal increase quarter-to-quarter rather than a reversal of prior trends. On a year-ago basis, GDP in the G20 area was 3.1% higher in Q3 2025 compared with Q3 2024.
Why this matters
• Constraint: The pace of quarterly expansion (0.8%) continues to sit within the lower half of historical outcomes for broad aggregates, which may limit baseline assumptions for near-term growth planning.
• Flexibility: The mixture of individual country outcomes suggests that different regions can adapt differently to changing conditions, leaving some room to adjust planning inputs such as demand assumptions or capacity utilisation.
• Optionality: Because no single acceleration or contraction dominates the aggregate picture, a broader range of scenarios remains plausible for medium-term strategy, contingent on individual member trends rather than uniform global shifts.
Economic audit
This release confirms an existing baseline that growth in the G20 area remains positive but uneven across members. It does not materially shift long-term assumptions; instead, it shows continuity in the pattern of modest quarter-to-quarter expansion with diverse country-level dynamics.
Calcufinder context
This GDP data can inform variables in the Global portfolio allocation calculator, especially for the real growth input when comparing countries’ contributions to aggregate expansions or contractions.
Sources
OECD (primary):
• G20 GDP Growth, Third Quarter of 2025 — Statistical Release (15 December 2025)
https://www.oecd.org/content/dam/oecd/en/data/insights/statistical-releases/2025/12/g20-gdp-growth-Q3-2025.pdf
(No secondary source used because all required figures are published directly by OECD.)
Disclaimer: This article is for general information only and is not financial advice. You are responsible for your own financial decisions.

